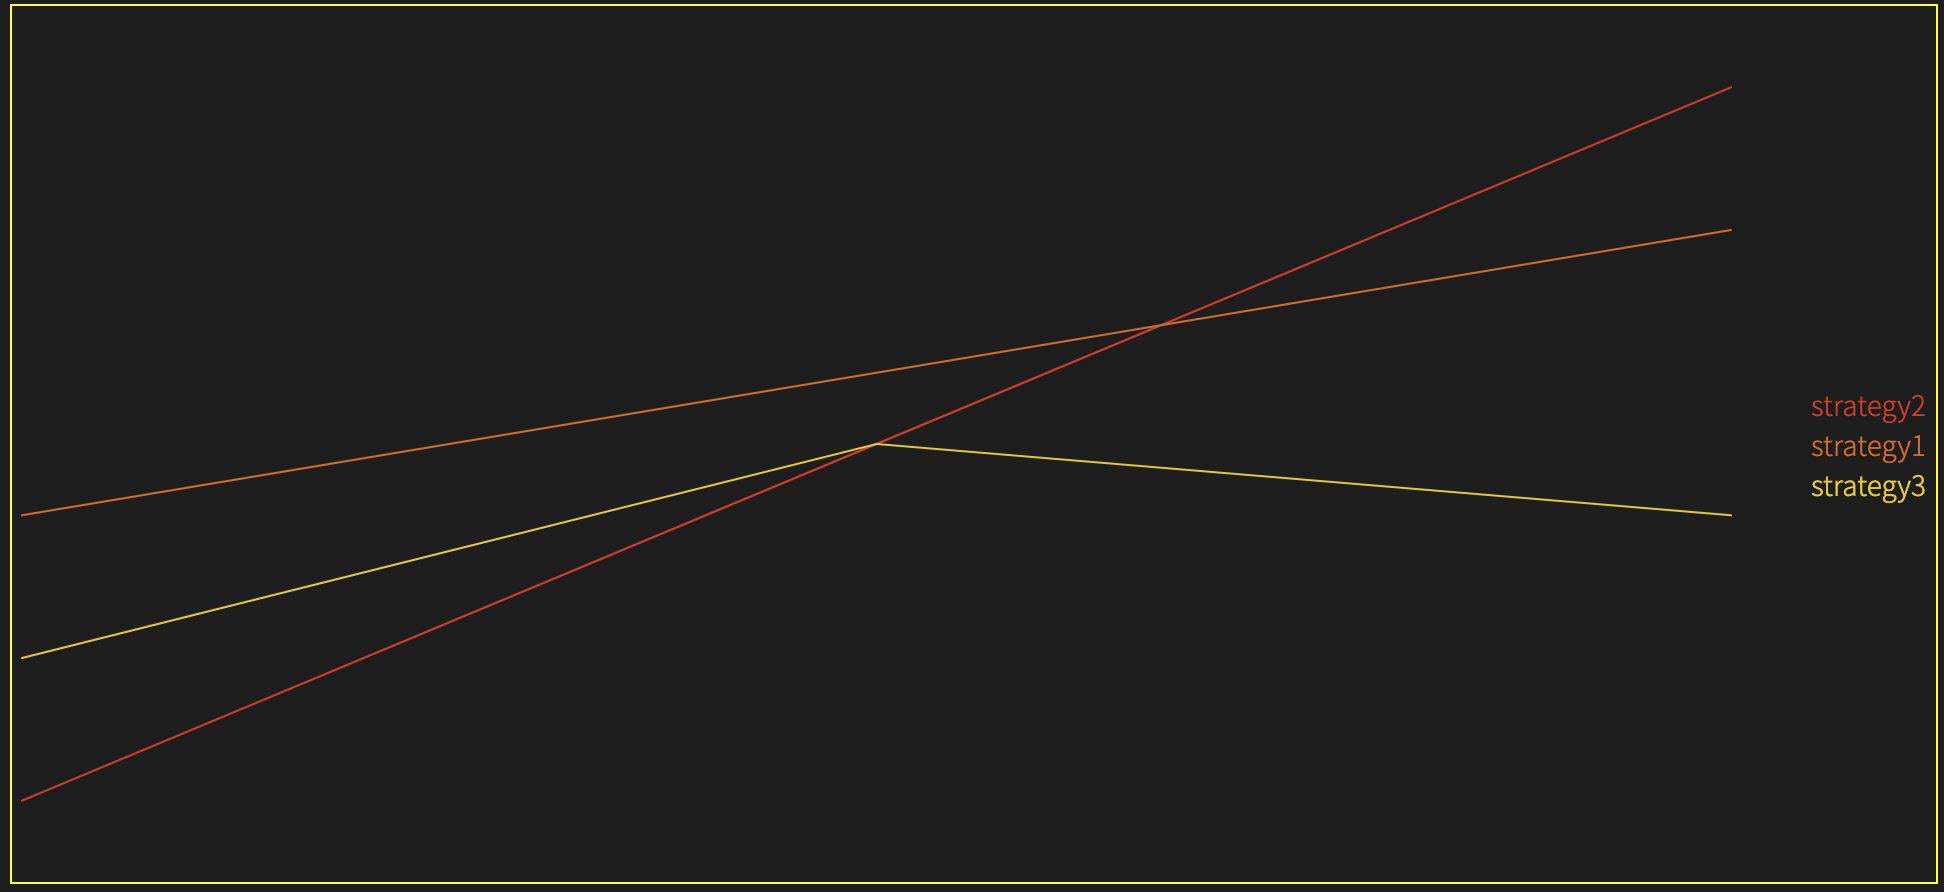
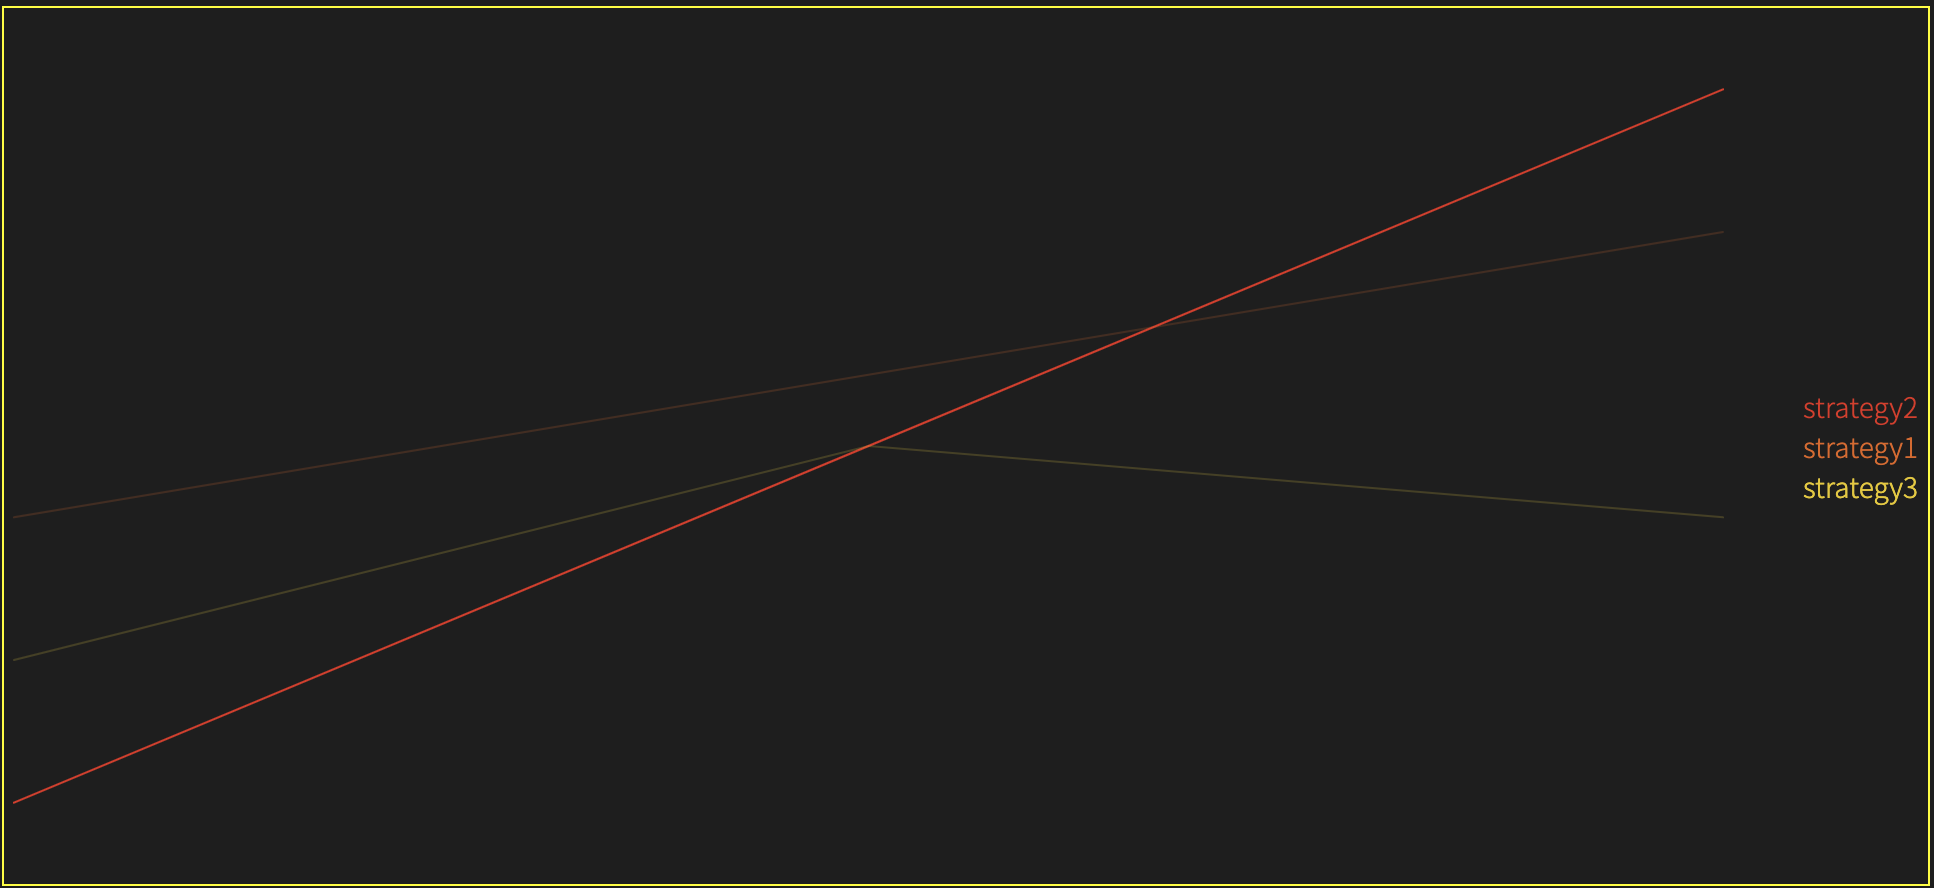
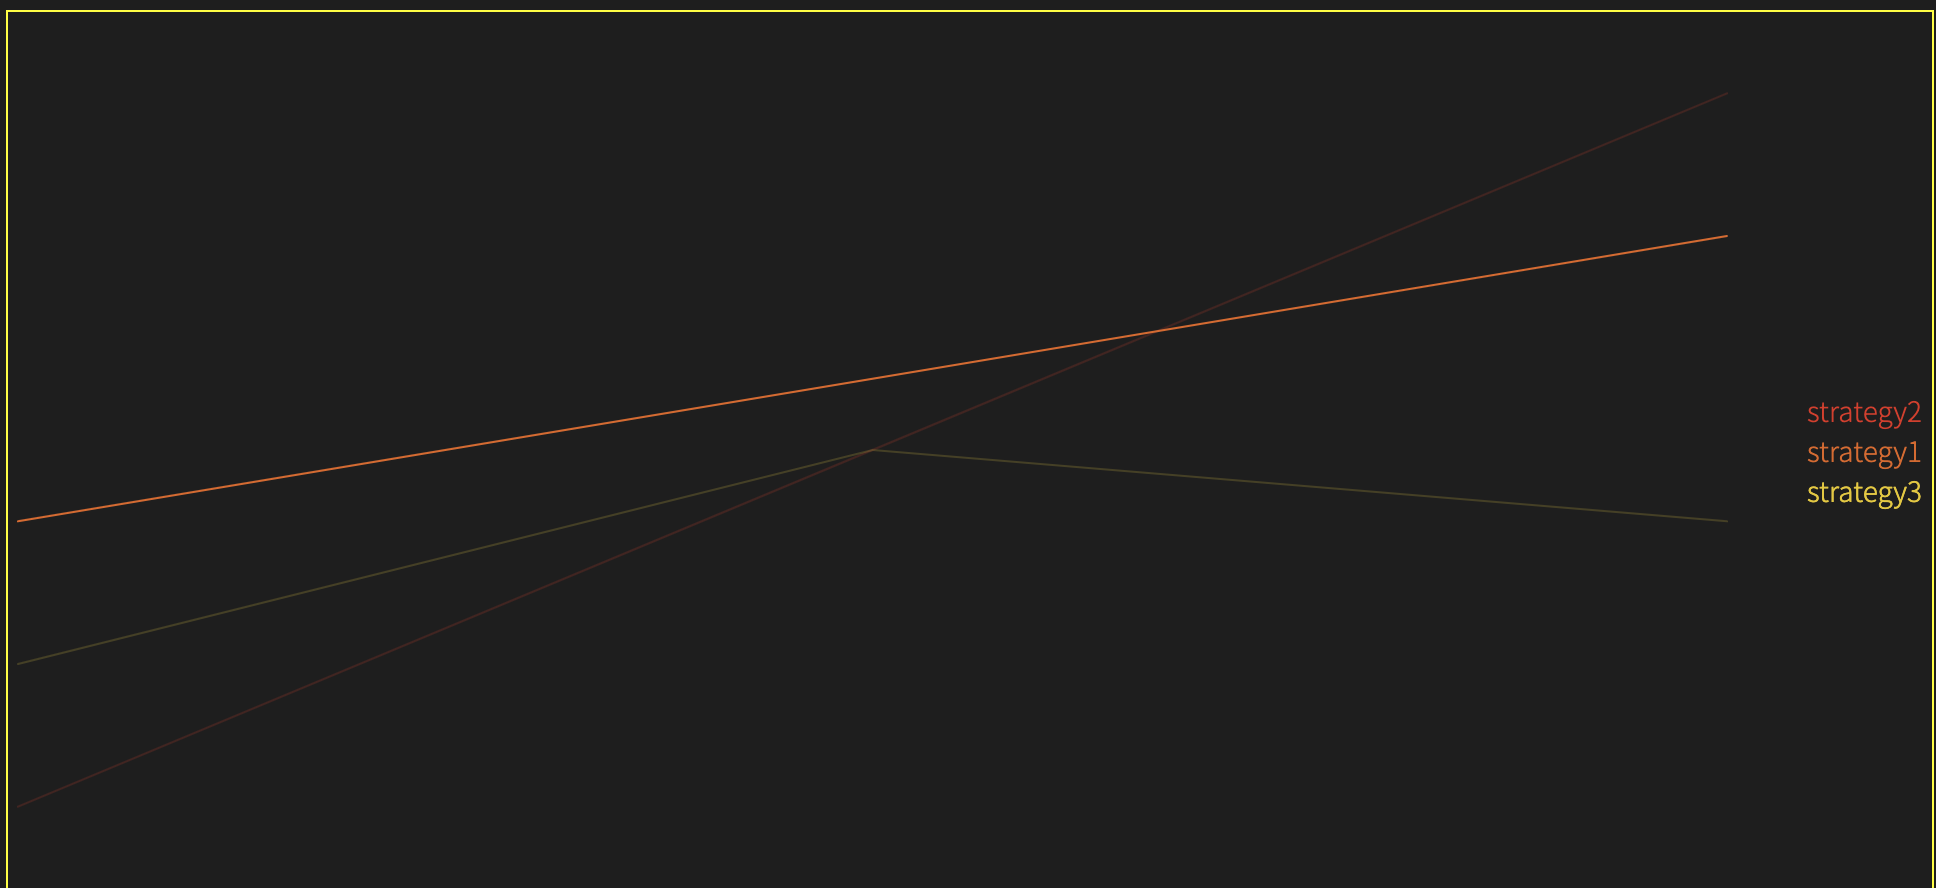
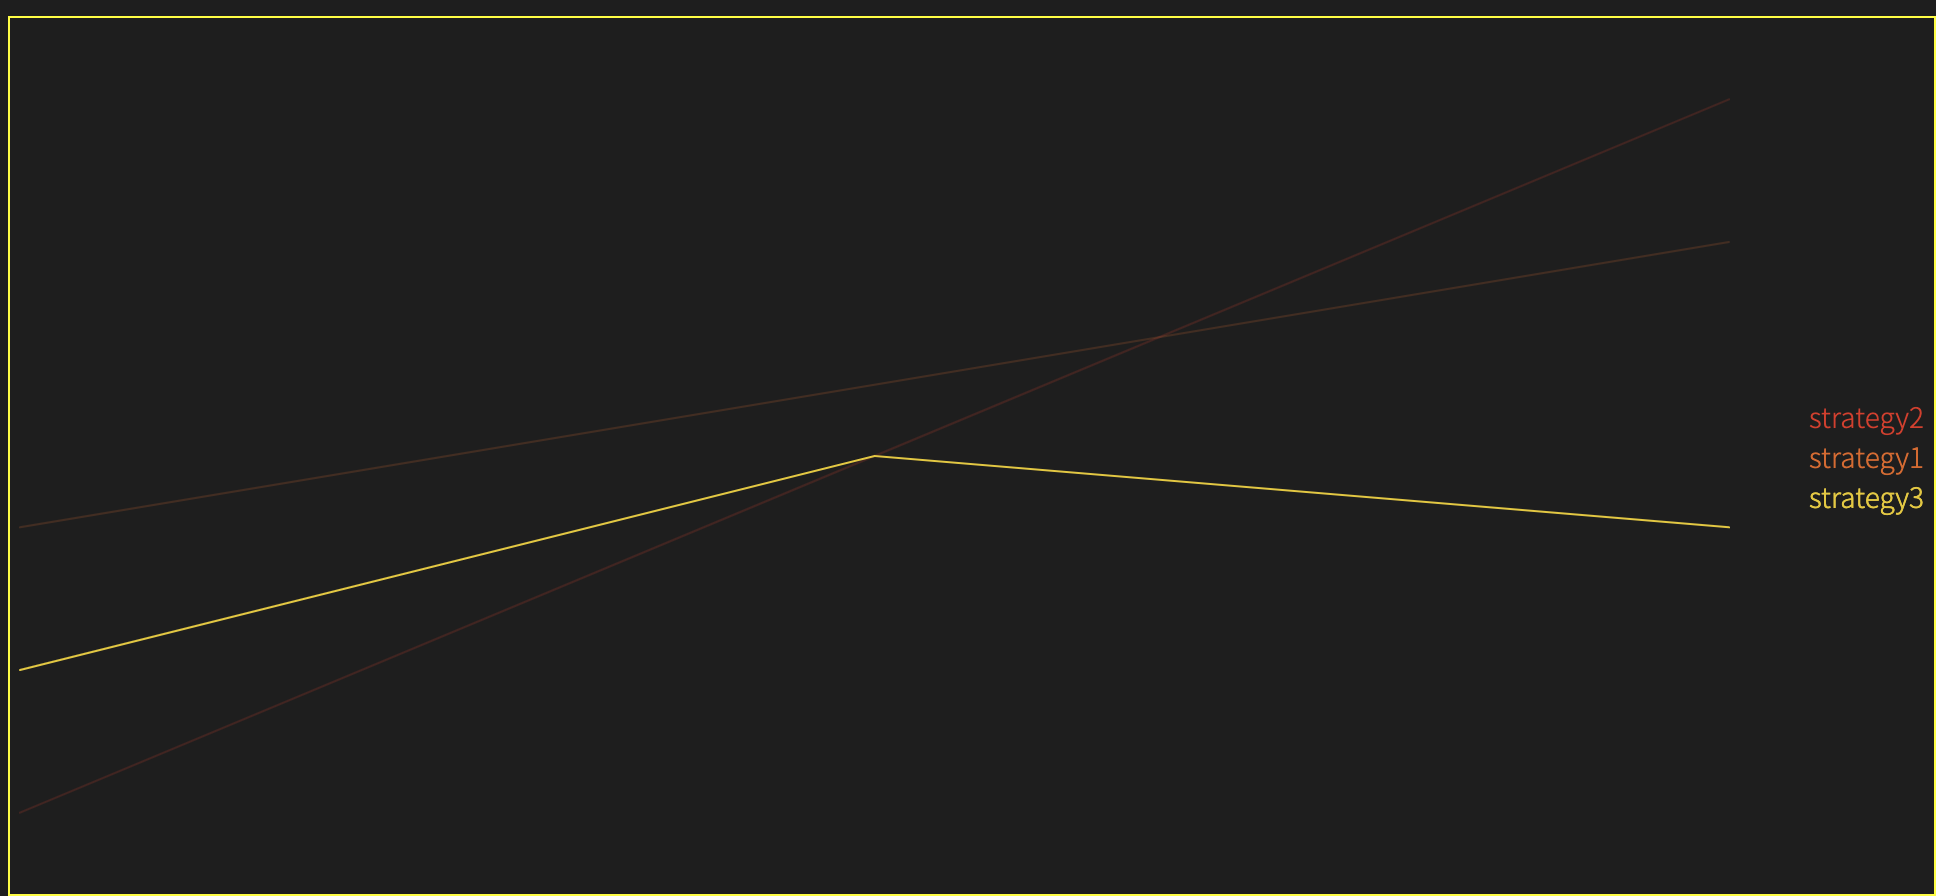
1
2
3
4
5
6
7
8
9
10
11
12
13
14
15
16
17
18
19
20
21
22
23
24
25
26
27
28
29
30
31
32
33
34
35
36
37
38
39
40
41
42
43
44
45
46
47
48
49
50
51
52
53
54
55
56
57
58
59
60
61
62
63
64
65
66
67
68
69
70
71
72
73
74
75
76
77
78
79
80
81
82
83
84
85
86
87
88
89
90
91
92
93
94
95
96
97
98
99
100
101
| import { useEffect, useState } from "react";
import {
LineChart,
Line,
Tooltip,
Legend,
ResponsiveContainer,
} from "recharts";
import colors from "styles/colors";
const CustomLegend = (props: any) => {
  const { payload, onMouseEnter, onMouseLeave } = props;

  return (
    <ul>
      {payload.map((entry: any, index: any) => (
        <li
          key={`item-${index}`}
          onMouseEnter={onMouseEnter}
          onMouseLeave={onMouseLeave}
          style={{ listStyle: "none", color: colors.GRAPH[`${index + 1}`] }}
        >
          {entry.value}
        </li>
      ))}
    </ul>
  );
};
function NewPortChart() {
const [opacity, setOpacity] = useState<any>({});
const handleMouseEnter = (o: any) => {
  const dataKey = o.target.innerHTML;

  const entries = Object.entries(opacity).map(([key, value]) =>
    key === dataKey ? [key, 1] : [key, 0.2]
  );

  const mappedObj: any = entries.reduce((prev, curr) => {
    const [key, value] = curr;
    prev = { ...prev, [key]: value };
    return prev;
  }, {});

  setOpacity(mappedObj);
};
const handleMouseLeave = () => {
const entries = Object.entries(opacity).map(([key, value]) => [key, 1]);
const mappedObj: any = entries.reduce((prev, curr) => {
const [key, value] = curr;
prev = { ...prev, [key]: value };
return prev;
}, {});
setOpacity(mappedObj);
};
useEffect(() => {
const mappedOpacity = Object.keys(data[0]).reduce((prev, curr) => {
prev = { ...prev, [curr]: 1 };
return prev;
}, {});
setOpacity(mappedOpacity);
}, []);
return (
<ResponsiveContainer width="100%" height="100%">
<LineChart width={857} height={440} data={data}>
<Tooltip />
<Legend
align="right"
verticalAlign="middle"
layout="vertical"
content={
<CustomLegend
onMouseEnter={handleMouseEnter}
onMouseLeave={handleMouseLeave}
/>
}
/>
{Object.keys(data[0]).map((key, index) => (
<Line
key={key}
type="linear"
dataKey={key}
strokeOpacity={opacity[key]}
strokeLinecap="round"
stroke={colors.GRAPH[`${index + 1}`]}
activeDot={false}
dot={false}
/>
))}
</LineChart>
</ResponsiveContainer>
);
}
export default NewPortChart;
|


